

Perses support for Prometheus
Perses is an open-source dashboard and visualization platform designed for observability, with native support for Prometheus as a data source. It enables users to create, manage, and share dashboards for monitoring metrics and visualizing data. Perses aims to provide a simple, flexible, and extensible alternative to other dashboarding tools, focusing on ease of use, community-driven development, GitOps capabilities and dashboard as code approach.
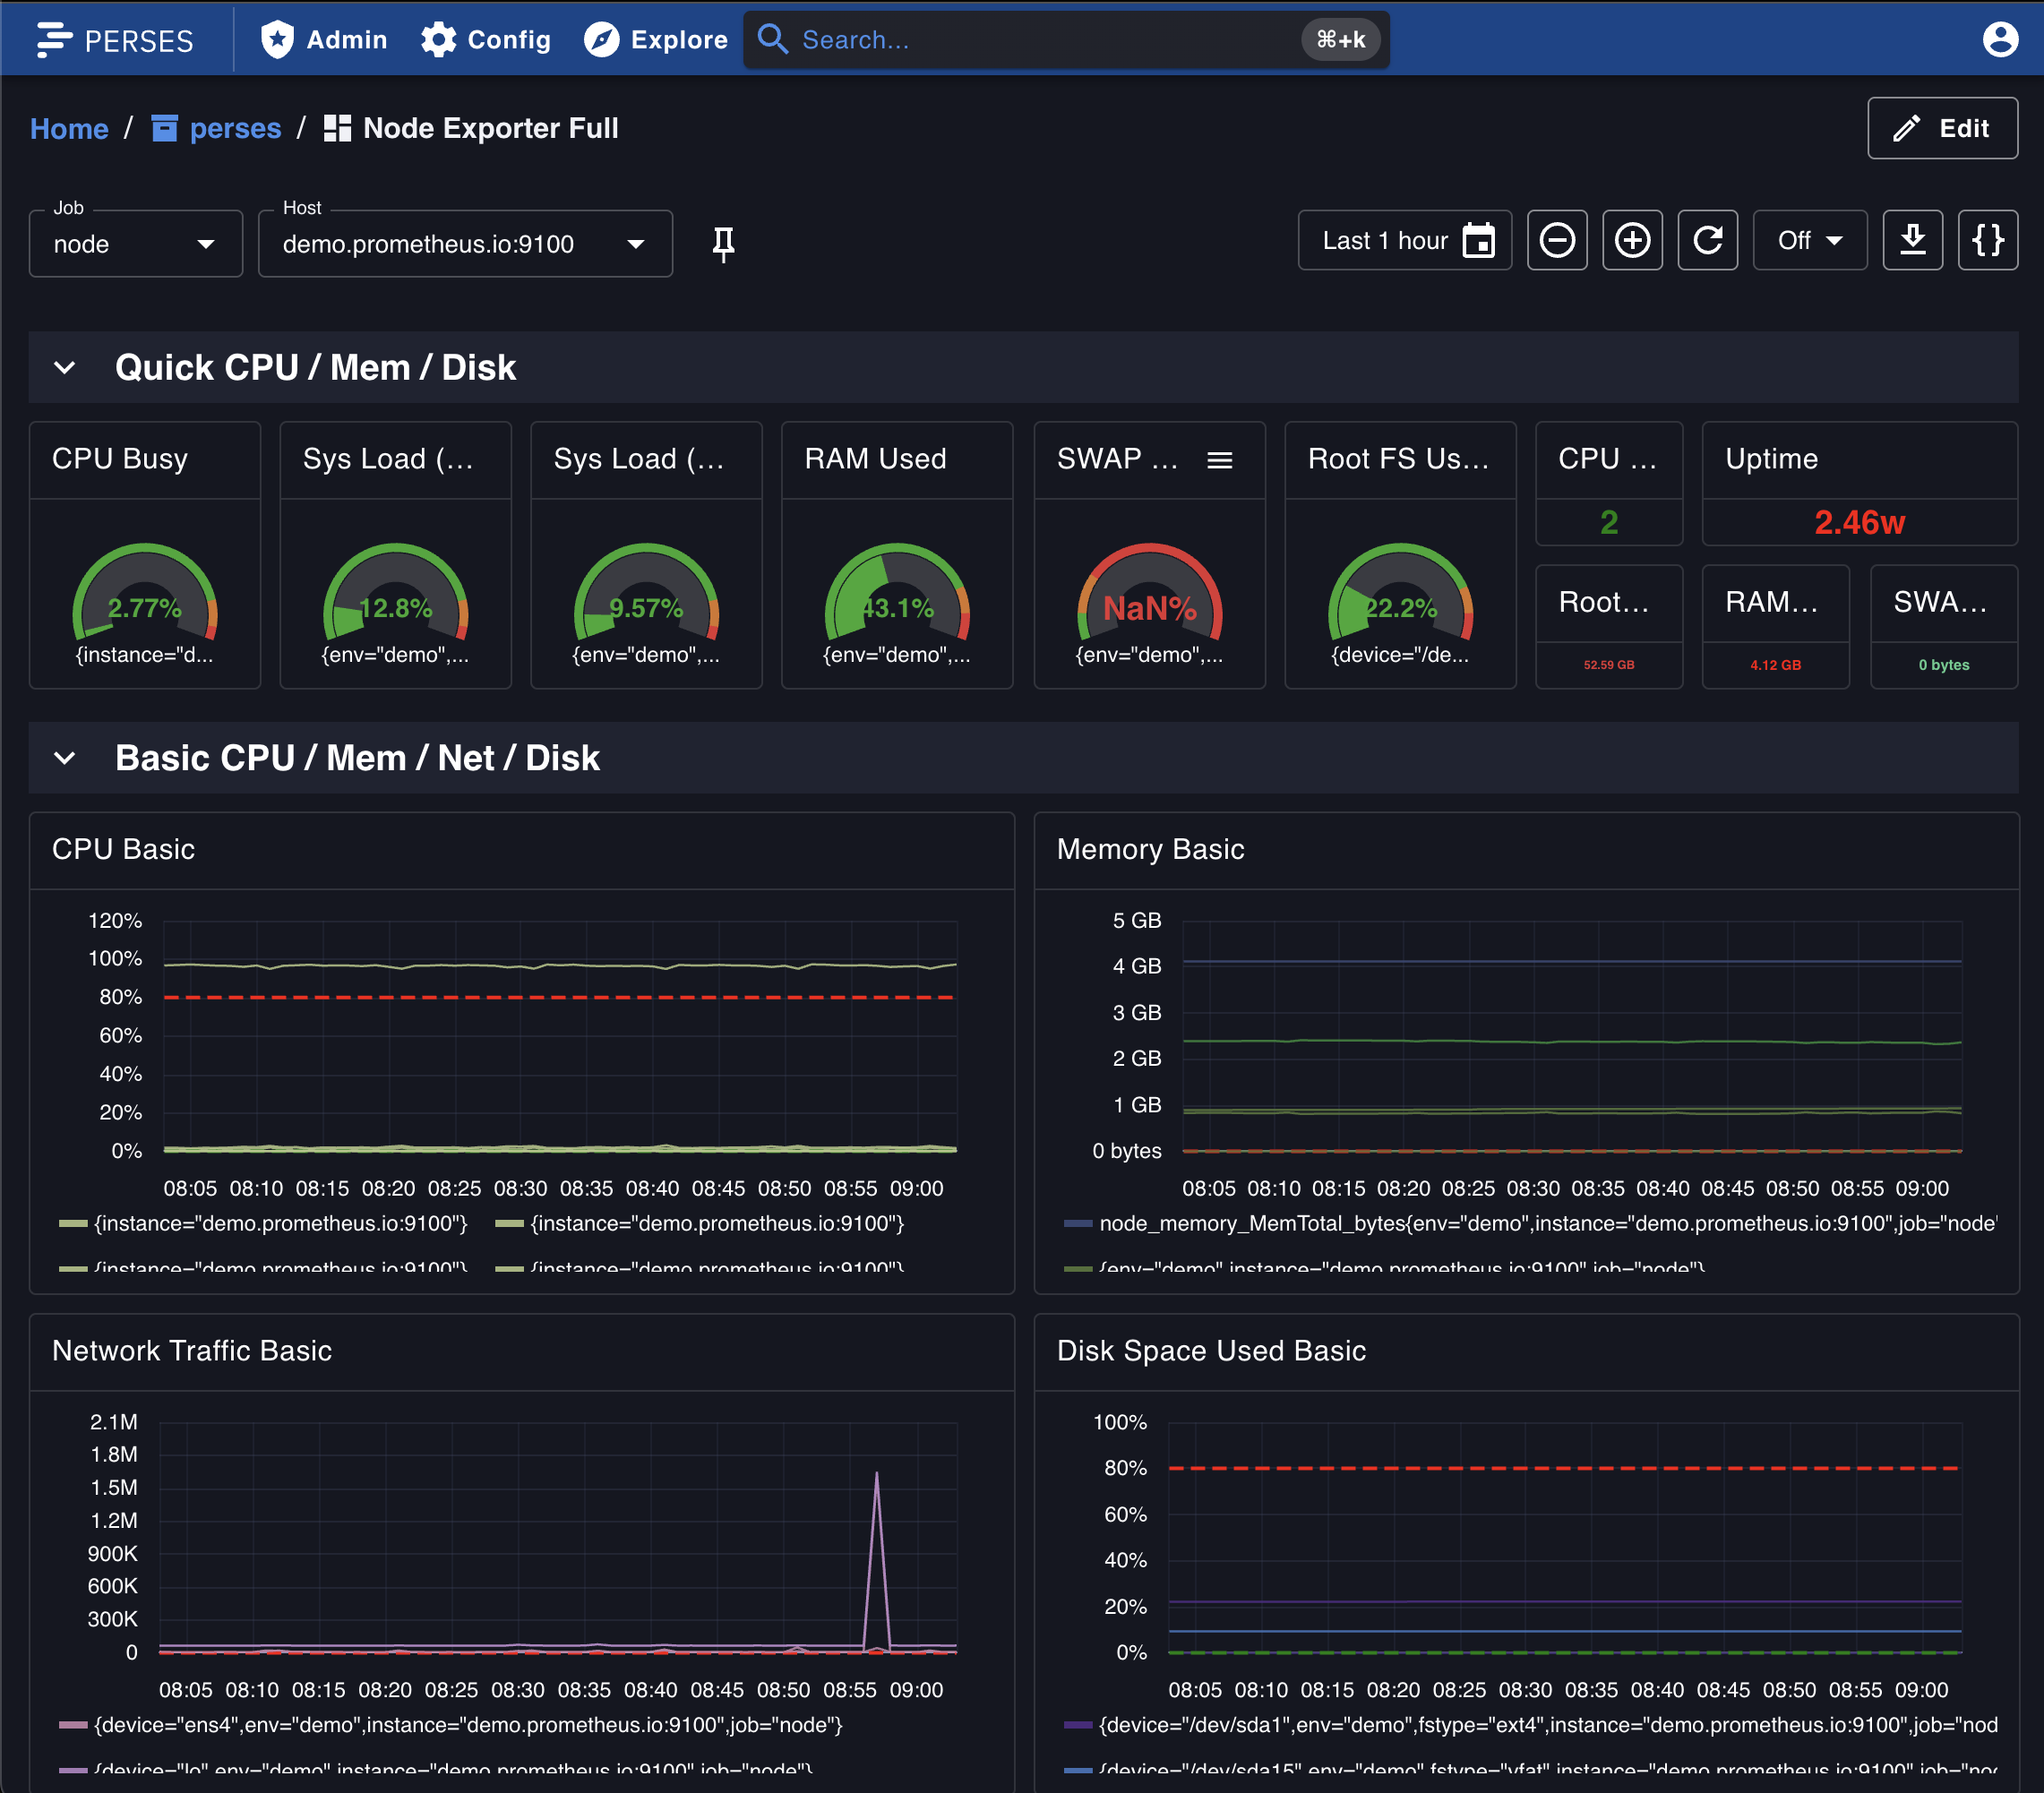
Here is an example of a Perses dashboard querying Prometheus for data:
Installing
To install Perses, see the official Perses documentation .
Using
By default, Perses will be listening on port 8080. You can access the web UI at http://localhost:8080. There is no
login by default.
Creating a Prometheus data source
To learn about how to set up a data source in Perses, please refer to Perses documentation . Once this connection to your Prometheus instance is configured, you are able to query it from the Dashboard and Explore views.
Importing pre-built dashboards
Perses is providing a set of pre-built dashboards that you can import into your instance. These dashboards are maintained by the community and can be found in the Perses dashboard repository