Instrumenting HTTP server written in Go
In this tutorial we will create a simple Go HTTP server and instrument it by adding a counter metric to keep count of the total number of requests processed by the server.
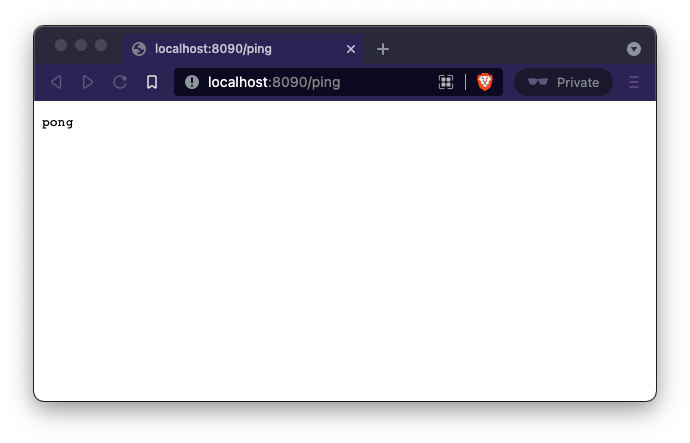
Here we have a simple HTTP server with /ping endpoint which returns pong as response.
package main

import (
   "fmt"
   "net/http"
)

func ping(w http.ResponseWriter, req *http.Request) {
   fmt.Fprintf(w,"pong")
}

func main() {
   http.HandleFunc("/ping", ping)

   http.ListenAndServe(":8090", nil)
}
Compile and run the server
go build server.go
./server
Now open http://localhost:8090/ping in your browser and you must see pong.
Now let's add a metric to the server which will instrument the number of requests made to the ping endpoint. The counter metric type is suitable for this as we know the request count doesn’t go down and only increases.
Create a Prometheus counter
type metrics struct {
	pingCounter prometheus.Counter
}

func newMetrics(reg prometheus.Registerer) *metrics {
	m := &metrics{
		pingCounter: promauto.With(reg).NewCounter(
			prometheus.CounterOpts {
				Name: "ping_request_count",
				Help: "No of requests handled by Ping handler",
			}),
	}
	return m
}
Next, let's update the ping Handler to increase the count of the counter using metrics.pingCounter.Inc().
func ping(m *metrics) func(w http.ResponseWriter, req *http.Request) {
	return func(w http.ResponseWriter, req *http.Request) {
		m.pingCounter.Inc()
		fmt.Fprintf(w, "pong")
	}
}
Then register the metrics (in this case, only one counter) with a Prometheus registry and expose the metrics.
func main() {
	reg := prometheus.NewRegistry()
	m := newMetrics(reg)

	http.HandleFunc("/ping", ping(m))
	http.Handle("/metrics", promhttp.HandlerFor(reg, promhttp.HandlerOpts{}))
	http.ListenAndServe(":8090", nil)
}
The prometheus.MustRegister function registers the pingCounter with the default registry.
To expose the metrics, the Go Prometheus client library provides the promhttp package.
promhttp.Handler() provides an http.Handler which exposes the metrics registered in the default registry.
The sample code is now:
package main

import (
	"fmt"
	"net/http"

	"github.com/prometheus/client_golang/prometheus"
	"github.com/prometheus/client_golang/prometheus/promauto"
	"github.com/prometheus/client_golang/prometheus/promhttp"
)

type metrics struct {
	pingCounter prometheus.Counter
}

func newMetrics(reg prometheus.Registerer) *metrics {
	m := &metrics{
		pingCounter: promauto.With(reg).NewCounter(
			prometheus.CounterOpts{
				Name: "ping_request_count",
				Help: "No of request handled by Ping handler",
			}),
	}
	return m
}

func ping(m *metrics) func(w http.ResponseWriter, req *http.Request) {
	return func(w http.ResponseWriter, req *http.Request) {
		m.pingCounter.Inc()
		fmt.Fprintf(w, "pong")
	}
}

func main() {
	reg := prometheus.NewRegistry()
	m := newMetrics(reg)

	http.HandleFunc("/ping", ping(m))
	http.Handle("/metrics", promhttp.HandlerFor(reg, promhttp.HandlerOpts{}))
	http.ListenAndServe(":8090", nil)
}
Run the example
go mod init prom_example
go mod tidy
go run server.go
Now hit the localhost:8090/ping endpoint a couple of times and then send a request to localhost:8090/metrics to see the metrics.
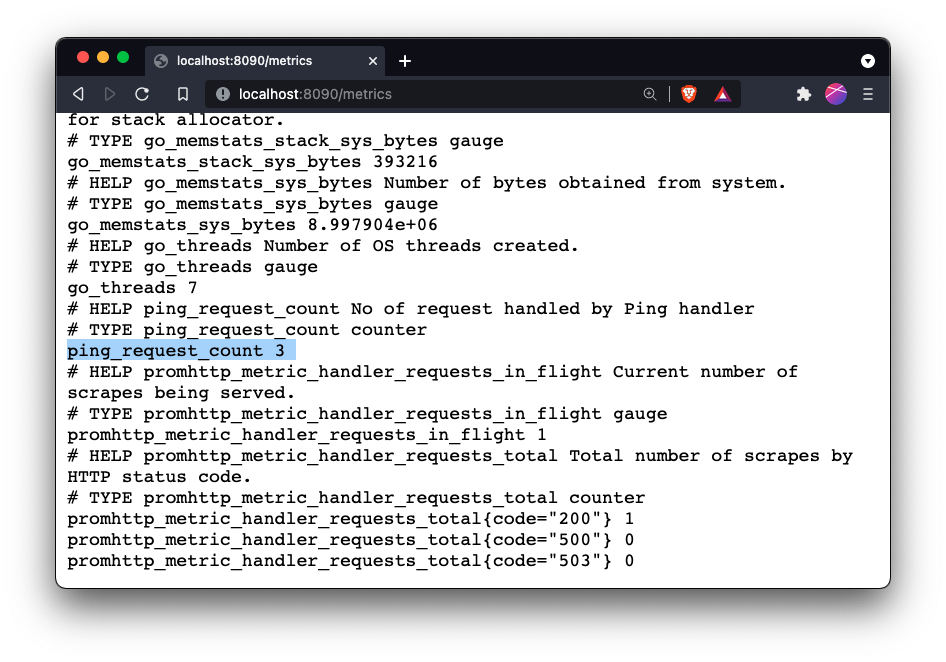
Here, the ping_request_count shows that the /ping endpoint was called 3 times.
The default registry comes with a collector for Go runtime metrics, and that is why we see other metrics like go_threads, go_goroutines, etc.
We have built our first metric exporter. Let’s update our Prometheus config to scrape the metrics from our server.
global:
  scrape_interval: 15s

scrape_configs:
  - job_name: prometheus
    static_configs:
      - targets: ["localhost:9090"]
  - job_name: simple_server
    static_configs:
      - targets: ["localhost:8090"]
prometheus --config.file=prometheus.yml